Tools
CISA has helped to develop the following tools to aid decision makers.
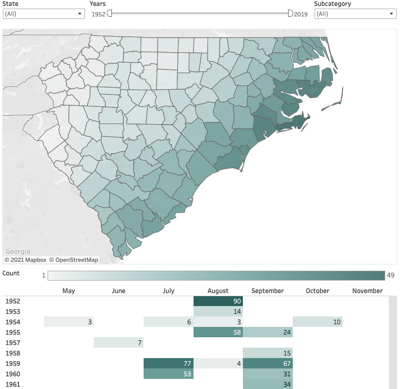
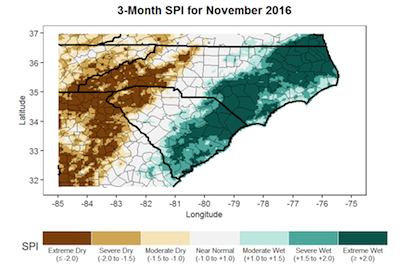
Carolinas Precipitation Patterns and Probabilities Atlas
The Carolinas Precipitation Patterns & Probabilities Atlas provides Carolinas-focused information about extremes (drought, heavy rainfall) and normal precipitation patterns. The Atlas includes over 1,000 downloadable maps and figures characterizing various measures of precipitation and drought. It offers information not readily available from other sources, such as frequency and duration of both dry and wet events, and photographs, videos, graphics, and narratives of the impacts of notable drought and heavy precipitation events in the Carolinas.
Carolinas Precipitation Patterns & Probabilities Atlas
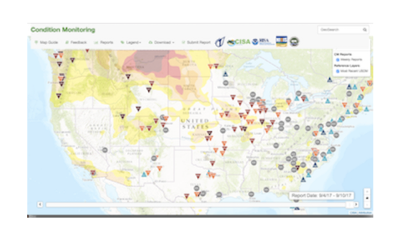
CoCoRaHS Condition Monitoring Web Map
The CoCoRaHS Condition Monitoring web map displays reports about local, community-level conditions and how recent weather and climate events have affected those communities. Volunteer observers provide weekly reports through the Community Collaborative Rain, Hail, and Snow (CoCoRaHS) website. The web map displays the reports along with the corresponding US Drought Monitor Map that can be used in the monitoring of drought onset, intensification, and recovery.
CoCoRaHS Condition Monitoring Map
Hazard Mitigation Planning Portal and Visualization Tool
The Hazard Mitigation Planning Portal and Visualization Tool is being designed to support communities of all sizes and socioeconomic status in incorporating relevant, timely, accessible historical and projected climate-related hazard information into their Hazard Mitigation Plans.
The Federal Emergency Management Agency (FEMA) requires all state, local, and tribal governments to have Hazard Mitigations Plans to be eligible for federal disaster mitigation grants. However, few state and local governments have the ability or capacity to integrate climate information into these plans or other comparable planning documents. The Portal will provide users with a single point of entry to community- and region- specific historical and projected data visualizations of climate-related metrics and impacts. CISA is collaborating with the Mid Atlantic (lead) and Great Lakes RISA teams and the Urban Sustainability Directors’ Network (USDN) to co-develop this Portal.
Hazard Mitigation Planning Portal and Visualization Tool
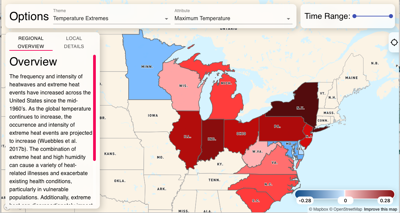
Convergence of Climate-Health-Vulnerabilities
Convergence contains a rich array of tools and infographics that reveal climate-health interactions, including weather extremes that impact community vulnerability. These resources include the weather extremes that impact community vulnerability. These resources include the Hazardous Extremes for Risk Assessment (HERA) tool crafted for local and regional decision-makers to assess and plan for meteorological and climatological hazards in their area. And the Wet Bulb Globe Temperature (WBGT) tool that provides decision-makers with hourly predictions of heat stress five days into the future.
Convergence of Climate-Health-Vulnerabilities