Winthrop Univ York County | SC Climate Division 3 | ID# 389350 ◼ ◼ ◼
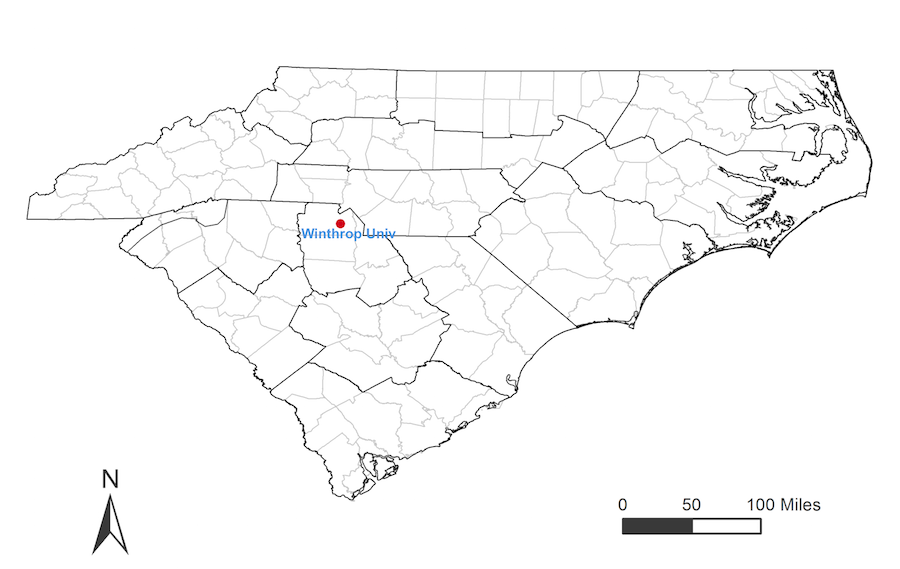
Winthrop Univ
Location: 34.94 °N, 81.03 °W
Elevation: 690 ft.
Record incorporates data from the following stations: WINTHROP COLLEGE, WINTHROP UNIV
Click on legend items to hide or reveal data ![]()
Winthrop Univ
Average Monthly Precipitation (in inches)
Data Source: Period of Record — Applied Climate Information System (ACIS); Climate Normals (if available) — NOAA’s National Centers for Environmental Information (NCEI)
Hover over squares for precipitation amounts ![]()
Winthrop Univ
Historical Monthly Precipitation (in inches)
(Months with missing data are coded 9999)
Data Source: Applied Climate Information System (ACIS)
Click on legend items to hide or reveal data ![]()
Winthrop Univ
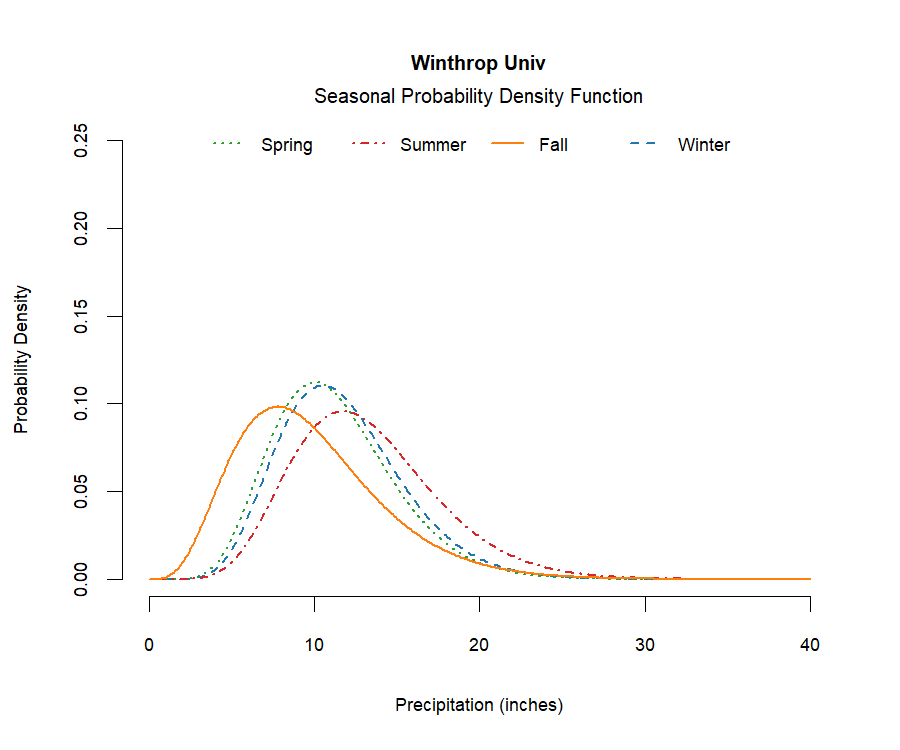
Seasonal Precipitation (in inches)
* Data Missing: May 1997; Mar, Dec 1998; Jun 1999; Dec 2000; Jul 2003; May 2005; Feb, Mar 2014.
Data Source: Applied Climate Information System (ACIS)
Click on legend label to hide and reveal lines connecting data
hover over points for more info
![]()
Winthrop Univ
Maximum Event Precipitation since 1980 (in inches)
Note: Some duration periods may overlap; the
longest duration appears on top.
Years with missing data are coded -9999.
Click on column headers to sort data
![]()
Maximun Event Precipitation for the Historic Record (in inches)
Data Source: Applied Climate Information System (ACIS)
1-Month 2-Month 3-Month 6-Month 9-Month 12-Month 24-Month All Multi-Duration
Data Source: Applied Climate Information System (ACIS)

12-month 18-month 24-month 36-month 48-month 60-month
Data Source: Applied Climate Information System (ACIS)
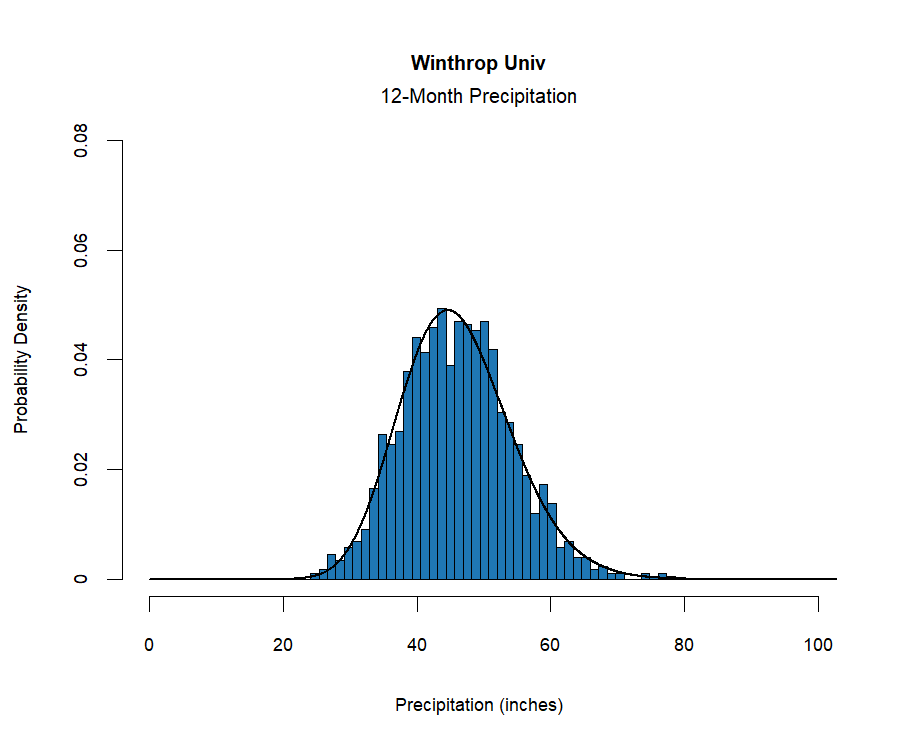
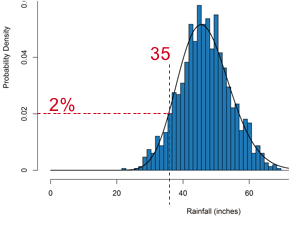 This chart shows the range and probability of specific precipitation totals. For example, there is about a 2% chance of getting just 35 inches of precipitation in a year. But if you look at the distribution of rainfall (historical rainfall amounts are shown by the blue bars, while the line graph smooths out this distribution), you can see that most years you are likely to get more precipitation than 35 inches.