c3p

Drought Return Period in the Carolinas

Reading this chart info-icon

25 years 50 years 100 years 200 years

contour map showing the 12-month drought return period in the Carolinas

Data Source: Applied Climate Information System (ACIS)

25 years 50 years 100 years 200 years

contour map showing the 18-month drought return period in the Carolinas

Data Source: Applied Climate Information System (ACIS)

25 years 50 years 100 years 200 years

contour map showing the 24-month drought return period in the Carolinas

Data Source: Applied Climate Information System (ACIS)

25 years 50 years 100 years 200 years

contour map showing the 36-month drought return period in the Carolinas

Data Source: Applied Climate Information System (ACIS)

25 years 50 years 100 years 200 years

contour map showing the 48-month drought return period in the Carolinas

Data Source: Applied Climate Information System (ACIS)

25 years 50 years 100 years 200 years

contour map showing the 60-month drought return period in the Carolinas

Data Source: Applied Climate Information System (ACIS)

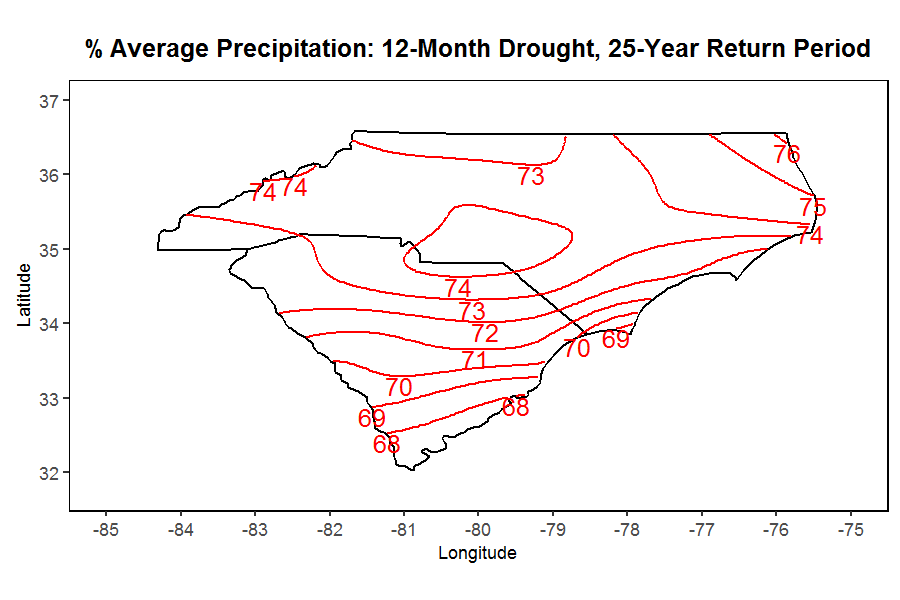
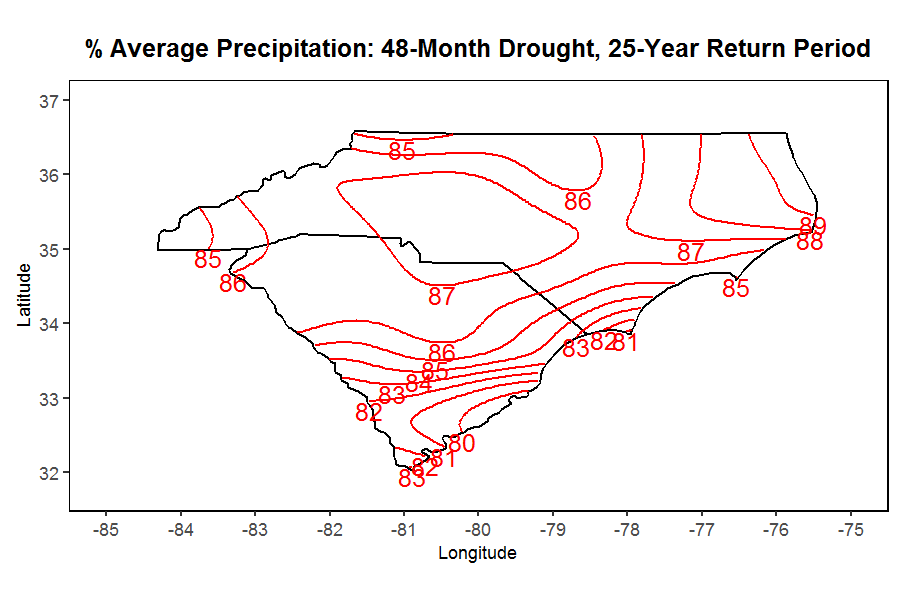
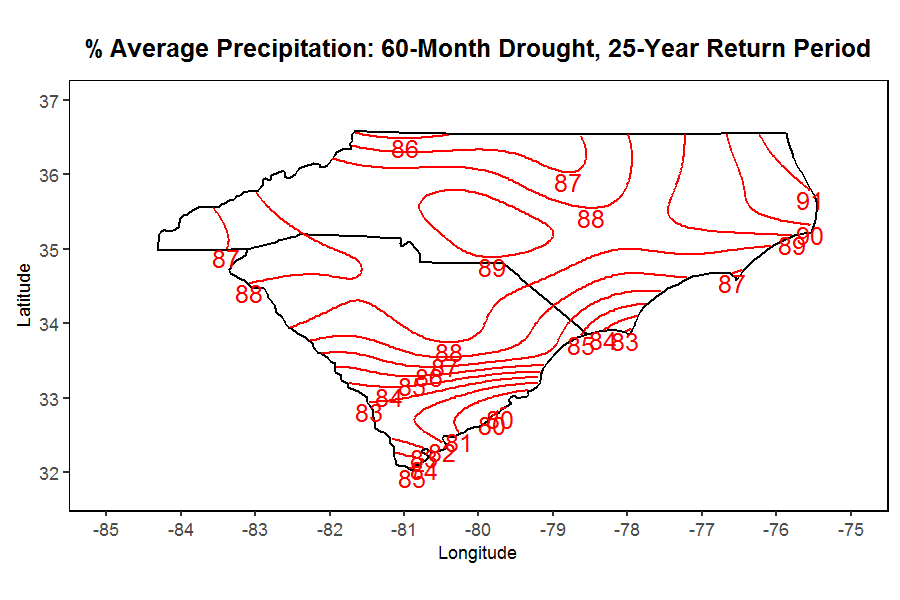
Reading a Drought Return Period Map

These maps show the percentage of average precipitation that can be expected for a specified length of time and specified return interval. You may choose 1- to 5-year lengths, and return periods from 25 to 200 years. These return periods actually refer to probability of occurrence in a single year. A 100-year return means that there is a 1 in 100 (1%) chance of occurrence in a single year. Thus, a contour labeled "87" (highlighted in yellow) on a map showing "60-month drought, 50-year return period" means that during a five-year stretch (60 months), there is a 2% chance of having about 87% of the average five-year precipitation total.

explanatory graphic for drought return period