SC Climate Division 2 — Northwest ◼ ◼
SC Climate Division 2 — Northwest
Eleven weather stations: ANDERSON, ANDERSON FAA AP, CHESNEE 7 WSW, CLEMSON UNIV, GASTON SHOALS, NINETY NINE ISLANDS, PICKENS, RAINBOW LAKE, SANTUCK, SIMMS WTP, UNION 8 S
Click on legend items to hide or reveal data ![]()
SC Climate Division 2 — Northwest
Average Monthly Precipitation
Data Source: NOAA’s Satellite and Information Service | National Environmental Satellite, Data, and Information Service (NESDIS)
Hover over squares for precipitation amounts ![]()
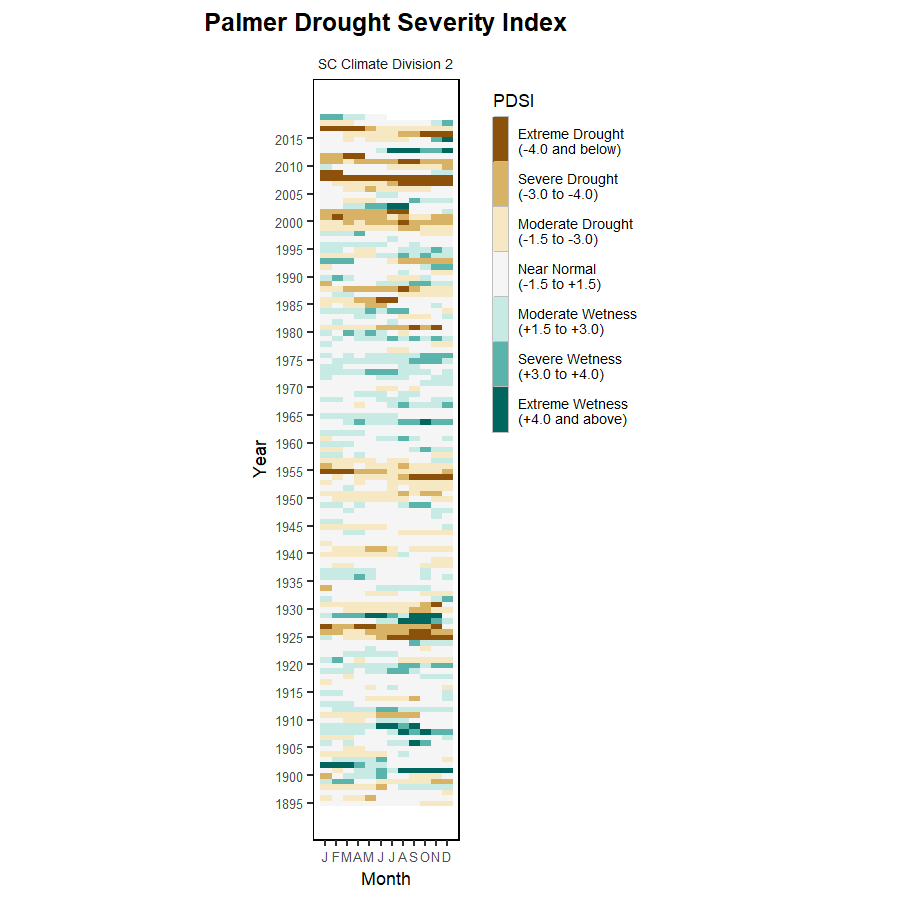
SC Climate Division 2 — Northwest
Historical Monthly Precipitation, 1895–2016
Data Source: NOAA’s Satellite and Information Service | National Environmental Satellite, Data, and Information Service (NESDIS)